

Why it’s more complete than /rosout
Robot logs are usually scattered: each program prints in its own format, and a lot of output — library messages, the launch system, low-level connection errors — never reaches the standard ROS log topic at all. The Logging page reads the robot’s raw console instead, which is a complete superset, and structures it for you. So things that would otherwise be invisible off-robot show up here.
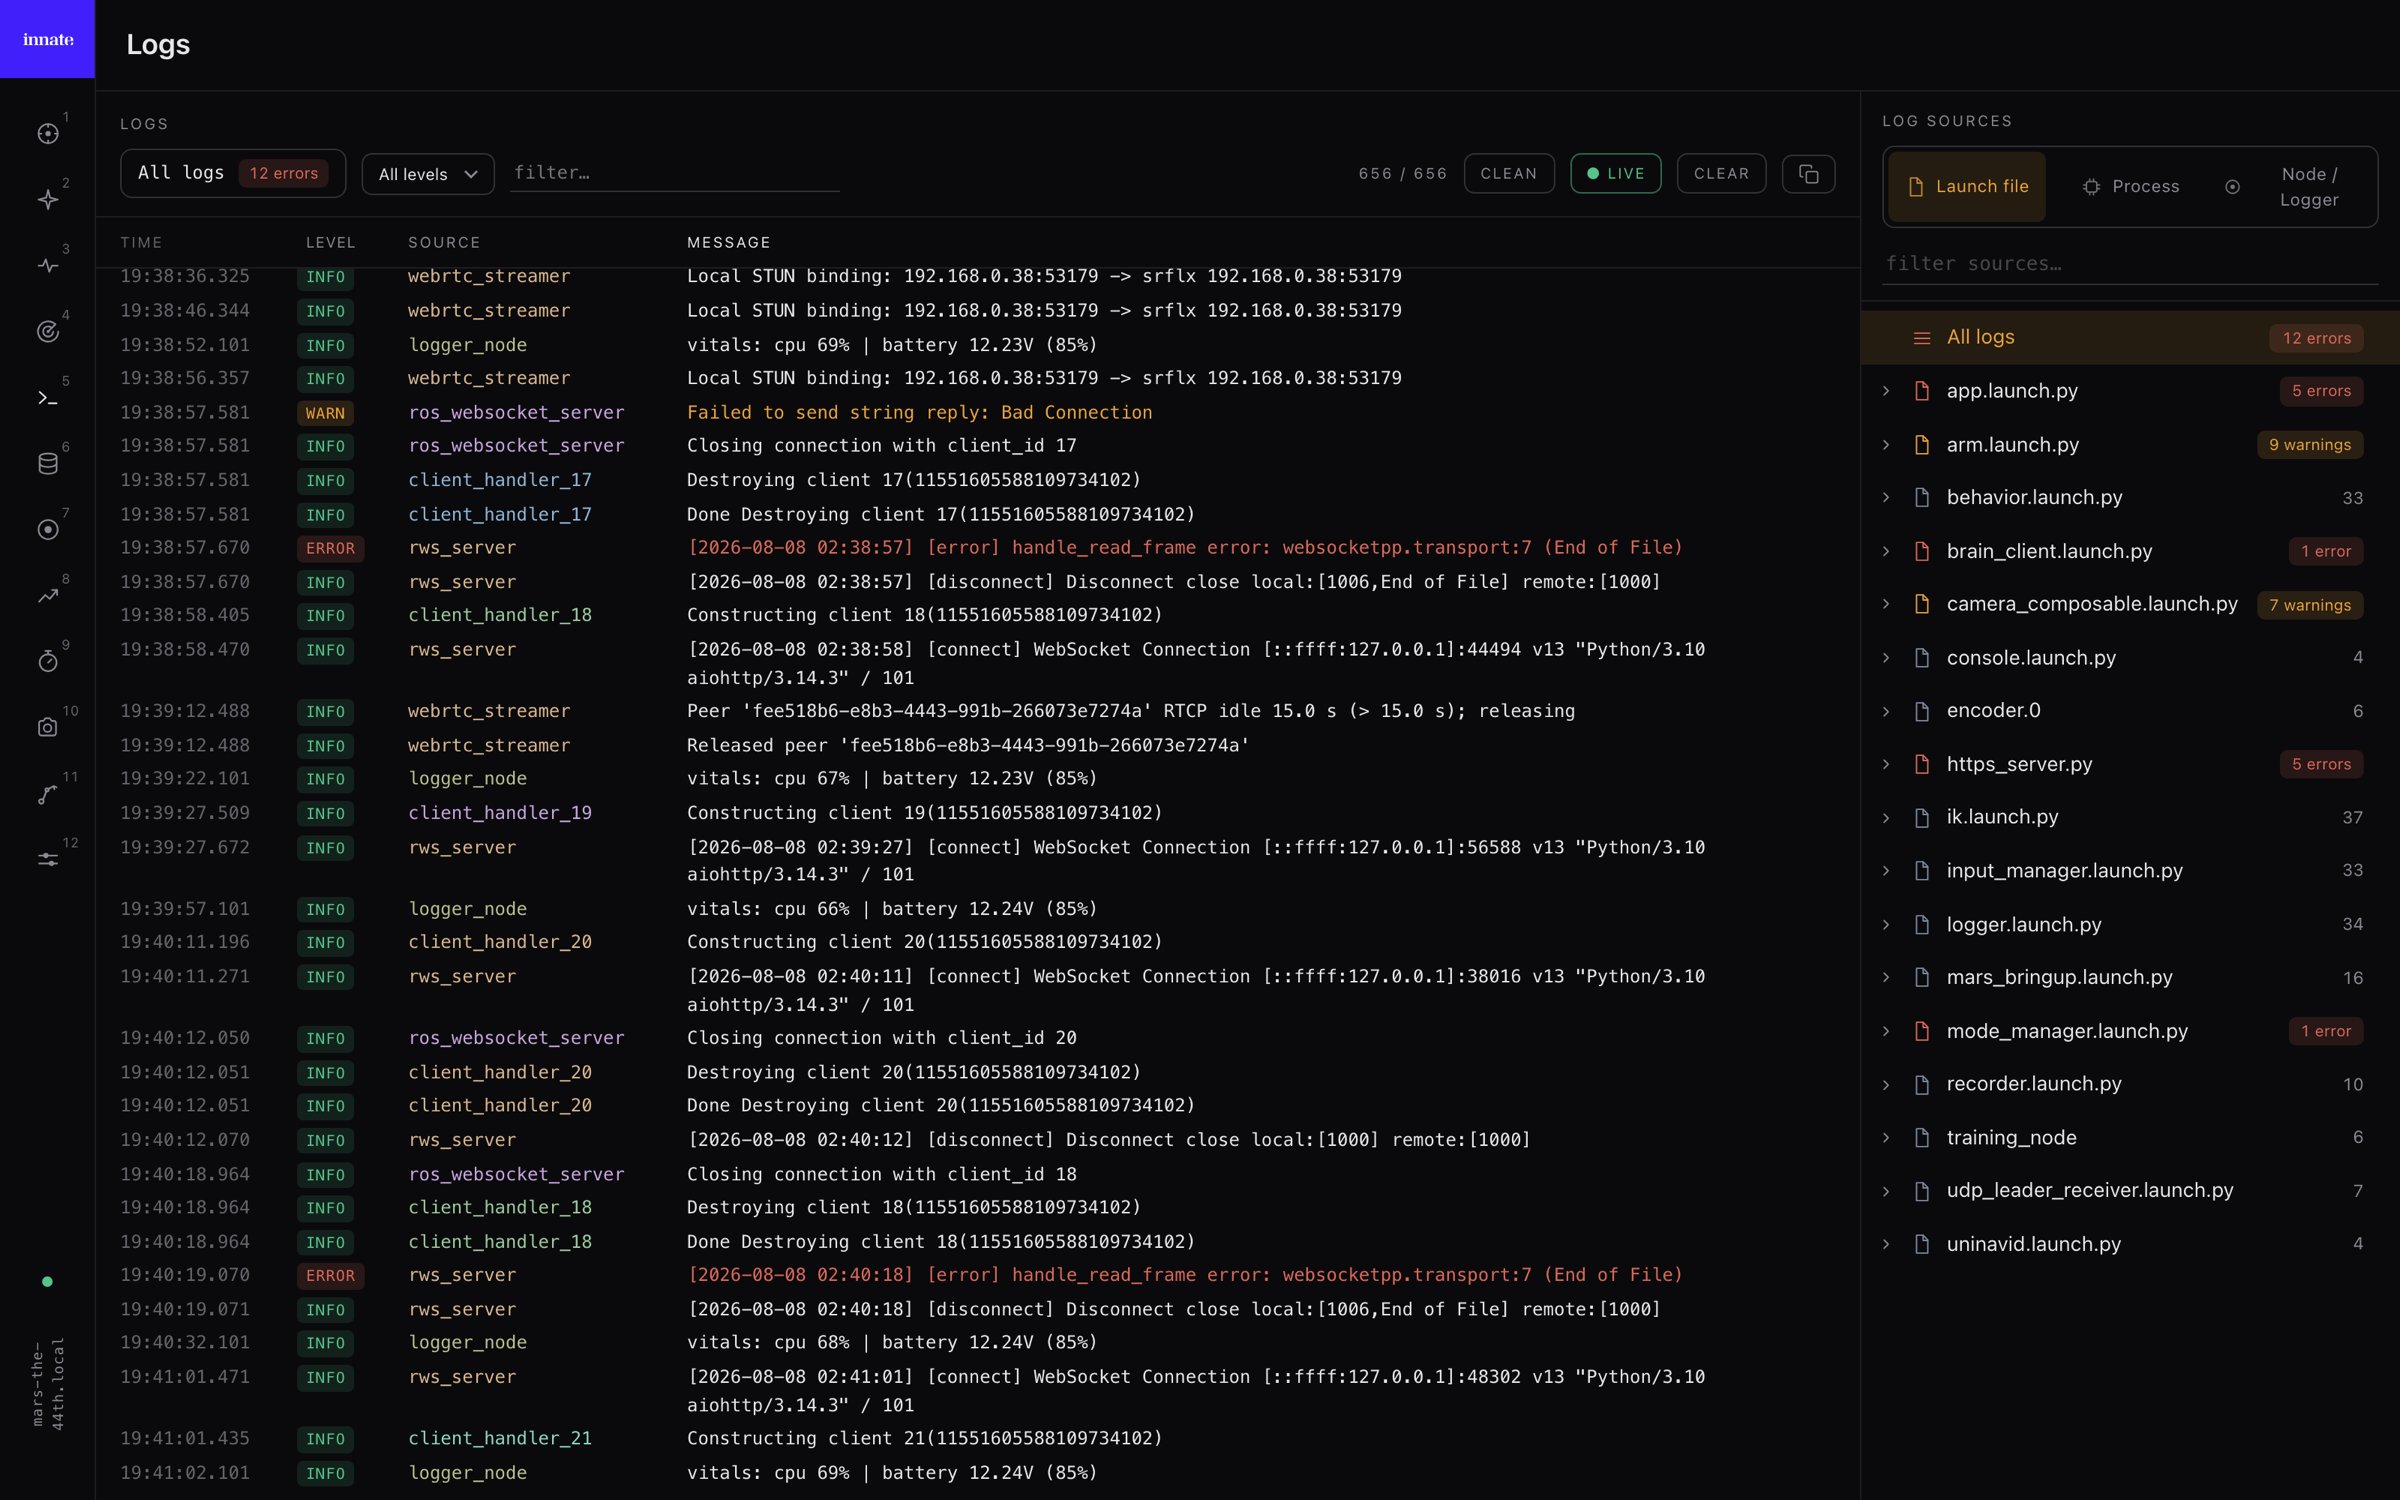
The log view
Two behaviors aren’t obvious from looking at it: Clean parses each line down to its message, while raw keeps the original text; and Live tails new output, pausing autoscroll when you scroll up so you can read, then resuming when you scroll back down.Log sources
The panel on the right re-pivots the same logs three ways — the full launch file → process → node → logger hierarchy, flat by process, or flat by node/logger. Click a source to scope the log view to it. Each entry carries a health tint rolled up from the worst severity beneath it, so a subsystem with errors stands out before you’ve read a single line.Per-connection loggers (one per client that connects to the robot) are grouped together so they don’t flood the source list — each line still shows its specific source in the log’s Source column.